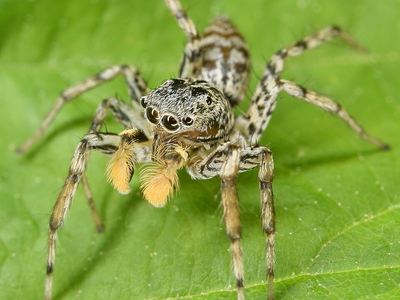
Familiar jumping spider (Platycryptus undatus)
The familiar jumping spider is a spider in the family Salticidae that is not dangerous to people. GBIF holds 4,619 licensed U.S. records of it; it reaches our listing threshold in 36 states, most of all Texas (518), Virginia (423) and Ohio (277). Its observation records peak in August.
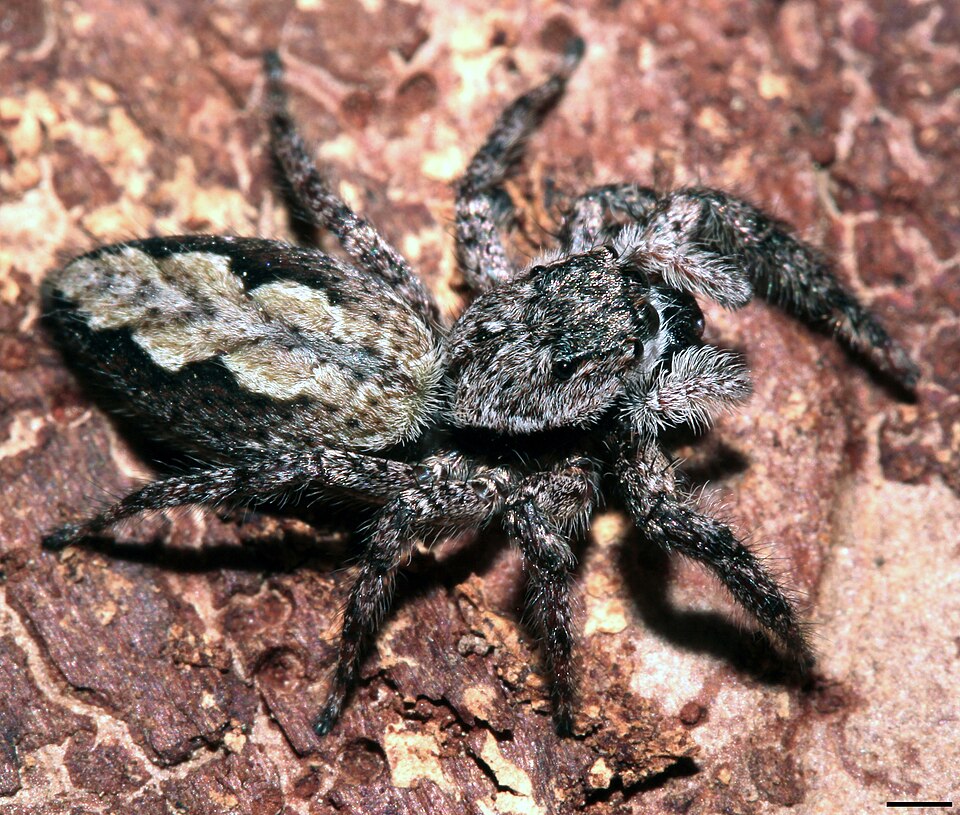

Platycryptus undatus, also called the tan or familiar jumping spider, is a species of jumping spider (family Salticidae), native to North America.
From Wikipedia: Platycryptus undatus, text under CC BY-SA 4.0.
Is the familiar jumping spider poisonous or venomous?
Not in any medically significant way. Like almost all spiders the familiar jumping spider (family Salticidae) has venom for its prey, but it is not a widow or recluse, the two U.S. groups whose bites need medical attention.
Which states have the familiar jumping spider?
Records are spread over 36 states; the top three, Texas, Virginia and Ohio, hold 26% of them. It is the most recorded spider of all in Indiana, Michigan and Rhode Island.
| # | State | Records | Share of state spiders | Rank in state |
|---|---|---|---|---|
| 1 | Texas | 518 | 1.8% | 9th of 386 |
| 2 | Virginia | 423 | 3.7% | 5th of 176 |
| 3 | Ohio | 277 | 4.0% | 3rd of 332 |
| 4 | Indiana | 271 | 6.1% | 1st of 133 |
| 5 | Maryland | 257 | 4.5% | 3rd of 153 |
| 6 | Massachusetts | 247 | 5.3% | 3rd of 189 |
| 7 | Oklahoma | 243 | 4.7% | 2nd of 149 |
| 8 | North Carolina | 242 | 2.9% | 4th of 184 |
| 9 | New York | 211 | 3.4% | 6th of 149 |
| 10 | Pennsylvania | 203 | 2.8% | 3rd of 164 |
| 11 | Missouri | 154 | 6.6% | 3rd of 117 |
| 12 | Michigan | 153 | 6.5% | 1st of 122 |
| 13 | Louisiana | 151 | 3.8% | 5th of 107 |
| 14 | Delaware | 122 | 5.8% | 3rd of 71 |
| 15 | Illinois | 117 | 0.6% | 25th of 243 |
| 16 | Georgia | 112 | 1.7% | 15th of 186 |
| 17 | Tennessee | 108 | 2.9% | 5th of 138 |
| 18 | New Jersey | 104 | 4.6% | 3rd of 127 |
| 19 | Alabama | 81 | 2.3% | 9th of 143 |
| 20 | Kansas | 81 | 4.9% | 3rd of 94 |
| 21 | Kentucky | 75 | 4.0% | 5th of 103 |
| 22 | Iowa | 64 | 9.4% | 2nd of 57 |
| 23 | Wisconsin | 60 | 1.9% | 6th of 149 |
| 24 | Arkansas | 48 | 2.9% | 3rd of 114 |
| 25 | Florida | 44 | 0.4% | 42nd of 237 |
| 26 | Connecticut | 38 | 3.8% | 6th of 86 |
| 27 | South Carolina | 38 | 1.6% | 15th of 121 |
| 28 | Minnesota | 31 | 1.0% | 23rd of 145 |
| 29 | Mississippi | 29 | 2.0% | 9th of 117 |
| 30 | Vermont | 27 | 1.7% | 13th of 74 |
| 31 | Nebraska | 24 | 1.9% | 6th of 71 |
| 32 | New Hampshire | 23 | 1.7% | 18th of 72 |
| 33 | West Virginia | 18 | 2.4% | 11th of 90 |
| 34 | Rhode Island | 12 | 7.0% | 1st of 53 |
| 35 | Maine | 9 | 1.0% | 27th of 297 |
| 36 | South Dakota | 2 | 1.0% | 18th of 29 |
When is the familiar jumping spider seen?
Across the U.S., observation records of the familiar jumping spider run mostly April through October, peaking in August with 15% of them. Winter (December to February) holds 3% of them.
Season by state
Observation records run through most of the year in Florida. Among states whose main season falls within one calendar year, it starts earliest in February (Louisiana, South Carolina and Virginia) and latest in May (Connecticut, Iowa, Michigan, Minnesota and New York). The most common peak month is September, shared by Alabama, Delaware, Illinois, Iowa, Kansas, Maryland and 3 more.
| State | Main season | Peak month | Observation records |
|---|---|---|---|
| Texas | March through November | April | 508 |
| Virginia | February through October | September | 421 |
| Ohio | April through September | September | 276 |
| Indiana | April through September | June | 263 |
| Maryland | April through October | September | 257 |
| Massachusetts | April through September | July | 247 |
| North Carolina | March through October | August | 242 |
| Oklahoma | April through October | July | 237 |
| New York | May through September | August | 211 |
| Pennsylvania | April through September | June | 198 |
| Michigan | May through September | July | 153 |
| Missouri | April through October | May | 153 |
| Louisiana | February through October | August | 151 |
| Delaware | April through October | September | 122 |
| Georgia | March through October | March | 112 |
| Tennessee | April through October | August | 107 |
| New Jersey | April through October | April | 103 |
| Illinois | April through September | September | 96 |
| Alabama | March through November | September | 81 |
| Kansas | March through September | September | 81 |
| Kentucky | April through September | May | 73 |
| Iowa | May through September | September | 63 |
| Wisconsin | March through September | July | 59 |
| Arkansas | March through October | October | 45 |
| Florida | most of the year | April | 42 |
| Connecticut | May through October | August | 38 |
| South Carolina | February through September | April | 36 |
| Minnesota | May through September | September | 31 |
Where the familiar jumping spider is recorded in each state
Texas
Texas holds 518 licensed records, the 9th most recorded of 386 spiders listed there. Its observation records in Texas run mostly March through November, peaking in April; most licensed records come from Dallas County, Jackson County and Harris County. Next come Hidalgo County (34) and Travis County (27).
Virginia
Virginia holds 423 licensed records, the 5th most recorded of 176 spiders listed there. Its observation records in Virginia run mostly February through October, peaking in September; most licensed records come from Fairfax County, Arlington County and Loudoun County. Next come Prince William County (20) and Norfolk (13).
Ohio
Ohio holds 277 licensed records, the 3rd most recorded of 332 spiders listed there. Its observation records in Ohio run mostly April through September, peaking in September; most licensed records come from Franklin County, Erie County and Montgomery County. Next come Butler County (21) and Cuyahoga County (20).
Indiana
Indiana holds 271 licensed records, the most recorded of 133 spiders listed there. Its observation records in Indiana run mostly April through September, peaking in June; most licensed records come from Allen County, Lake County and Tippecanoe County. Next come Marion County (19) and Monroe County (15).
Maryland
Maryland holds 257 licensed records, the 3rd most recorded of 153 spiders listed there. Its observation records in Maryland run mostly April through October, peaking in September; most licensed records come from Montgomery County, Frederick County and Baltimore County. Next come Howard County (32) and Anne Arundel County (31).
Massachusetts
Massachusetts holds 247 licensed records, the 3rd most recorded of 189 spiders listed there. Its observation records in Massachusetts run mostly April through September, peaking in July; most licensed records come from Middlesex County, Dukes County and Barnstable County. Next come Plymouth County (28) and Essex County (27).
Oklahoma
Oklahoma holds 243 licensed records, the 2nd most recorded of 149 spiders listed there. Its observation records in Oklahoma run mostly April through October, peaking in July; most licensed records come from Mayes County, Osage County and Tulsa County. Next come Cleveland County (26) and Woodward County (23).
North Carolina
North Carolina holds 242 licensed records, the 4th most recorded of 184 spiders listed there. Its observation records in North Carolina run mostly March through October, peaking in August; most licensed records come from Wake County, Orange County and Cumberland County. Next come Durham County (25) and Dare County (16).
New York
New York holds 211 licensed records, the 6th most recorded of 149 spiders listed there. Its observation records in New York run mostly May through September, peaking in August; most licensed records come from Tompkins County, Westchester County and Onondaga County. Next come Suffolk County (15) and Nassau County (11).
Pennsylvania
Pennsylvania holds 203 licensed records, the 3rd most recorded of 164 spiders listed there. Its observation records in Pennsylvania run mostly April through September, peaking in June; most licensed records come from Montgomery County, Philadelphia County and Bucks County. Next come Westmoreland County (15) and Chester County (13).
Missouri
Missouri holds 154 licensed records, the 3rd most recorded of 117 spiders listed there. Its observation records in Missouri run mostly April through October, peaking in May; most licensed records come from Texas County, St. Louis County and Boone County. Next come Dent County (10) and Johnson County (10).
Michigan
Michigan holds 153 licensed records, the most recorded of 122 spiders listed there. Its observation records in Michigan run mostly May through September, peaking in July; most licensed records come from Washtenaw County, Allegan County and Bay County. Next come Kalamazoo County (16) and Oakland County (15).
Louisiana
Louisiana holds 151 licensed records, the 5th most recorded of 107 spiders listed there. Its observation records in Louisiana run mostly February through October, peaking in August; most licensed records come from East Baton Rouge Parish, Saint Tammany Parish and Calcasieu Parish. Next come Jefferson Davis Parish (13) and Lafayette Parish (5).
Delaware
Delaware holds 122 licensed records, the 3rd most recorded of 71 spiders listed there. Its observation records in Delaware run mostly April through October, peaking in September; most licensed records come from Sussex County, Kent County and New Castle County.
Illinois
Illinois holds 117 licensed records, the 25th most recorded of 243 spiders listed there. Its observation records in Illinois run mostly April through September, peaking in September; most licensed records come from Champaign County, McLean County and Will County. Next come Kankakee County (8) and DuPage County (6).
Georgia
Georgia holds 112 licensed records, the 15th most recorded of 186 spiders listed there. Its observation records in Georgia run mostly March through October, peaking in March; most licensed records come from Clarke County, Gwinnett County and DeKalb County. Next come Bryan County (6) and Bartow County (6).
Tennessee
Tennessee holds 108 licensed records, the 5th most recorded of 138 spiders listed there. Its observation records in Tennessee run mostly April through October, peaking in August; most licensed records come from Knox County, Williamson County and Montgomery County. Next come Sevier County (7) and Davidson County (6).
New Jersey
New Jersey holds 104 licensed records, the 3rd most recorded of 127 spiders listed there. Its observation records in New Jersey run mostly April through October, peaking in April; most licensed records come from Cape May County, Middlesex County and Ocean County. Next come Burlington County (9) and Hunterdon County (8).
Alabama
Alabama holds 81 licensed records, the joint 9th most recorded of 143 spiders listed there. Its observation records in Alabama run mostly March through November, peaking in September; most licensed records come from Mobile County, Jefferson County and Blount County. Next come Tuscaloosa County (7) and Pickens County (5).
Kansas
Kansas holds 81 licensed records, the 3rd most recorded of 94 spiders listed there. Its observation records in Kansas run mostly March through September, peaking in September; most licensed records come from Leavenworth County, Douglas County and Shawnee County. Next come Riley County (6) and Wyandotte County (4).
Kentucky
Kentucky holds 75 licensed records, the 5th most recorded of 103 spiders listed there. Its observation records in Kentucky run mostly April through September, peaking in May; most licensed records come from Madison County, Jefferson County and Fayette County. Next come Rowan County (3) and Shelby County (3).
Iowa
Iowa holds 64 licensed records, the 2nd most recorded of 57 spiders listed there. Its observation records in Iowa run mostly May through September, peaking in September; most licensed records come from Harrison County, Johnson County and Linn County. Next come Shelby County (3) and Allamakee County (2).
Wisconsin
Wisconsin holds 60 licensed records, the joint 6th most recorded of 149 spiders listed there. Its observation records in Wisconsin run mostly March through September, peaking in July; most licensed records come from Dane County, Jefferson County and Sauk County. Next come Adams County (2) and Waukesha County (2).
Arkansas
Arkansas holds 48 licensed records, the 3rd most recorded of 114 spiders listed there. Its observation records in Arkansas run mostly March through October, peaking in October; most licensed records come from Craighead County, Benton County and Clay County. Next come Pike County (5) and Mississippi County (3).
Florida
Florida holds 44 licensed records, the joint 42nd most recorded of 237 spiders listed there. Its observation records in Florida run through most of the year, peaking in April; most licensed records come from Alachua County, Escambia County and Clay County. Next come Hillsborough County (3) and Marion County (3).
Top counties in the U.S.
| # | County | State | Records | Share of U.S. |
|---|---|---|---|---|
| 1 | Fairfax County | Virginia | 177 | 3.8% |
| 2 | Sussex County | Delaware | 100 | 2.2% |
| 3 | Allen County | Indiana | 93 | 2.0% |
| 4 | Mayes County | Oklahoma | 76 | 1.6% |
| 5 | Tompkins County | New York | 63 | 1.4% |
| 6 | Dallas County | Texas | 56 | 1.2% |
| 7 | Jackson County | Texas | 53 | 1.1% |
| 8 | Harris County | Texas | 52 | 1.1% |
| 9 | Osage County | Oklahoma | 50 | 1.1% |
| 10 | Middlesex County | Massachusetts | 48 | 1.0% |
| 11 | Wake County | North Carolina | 47 | 1.0% |
| 12 | Montgomery County | Maryland | 46 | 1.0% |
| 13 | Dukes County | Massachusetts | 46 | 1.0% |
| 14 | Lake County | Indiana | 44 | 1.0% |
| 15 | East Baton Rouge Parish | Louisiana | 44 | 1.0% |
How recent are the familiar jumping spider records?
Most of what is known about the familiar jumping spider is recent: 95% of dated U.S. records were made in 2017–2026, and half date from 2023 or later. The oldest dated record is from 1904; the busiest year was 2025, with 759 records.
| Decade | Records | Share |
|---|---|---|
| 1900s | 1 | 0.0% |
| 1920s | 2 | 0.0% |
| 1930s | 3 | 0.1% |
| 1940s | 9 | 0.2% |
| 1950s | 13 | 0.3% |
| 1960s | 3 | 0.1% |
| 1970s | 1 | 0.0% |
| 1980s | 2 | 0.0% |
| 1990s | 3 | 0.1% |
| 2000s | 11 | 0.2% |
| 2010s | 701 | 14.5% |
| 2020s | 4,069 | 84.5% |
Species recorded in the same counties
Of the 379 counties where the familiar jumping spider is most recorded, 239 are also top counties for the bold jumper, more than for any other spider. None of its closest neighbors is venomous.
| Species | Shared counties |
|---|---|
| Bold jumper | 239 |
| Black-and-yellow argiope | 237 |
| Spotted orbweaver | 214 |
| Nursery web spider | 208 |
| Orchard orbweaver | 188 |
| Spined micrathena | 183 |
| Dark fishing spider | 172 |
| Bronze jumper | 155 |
Related species in the U.S.
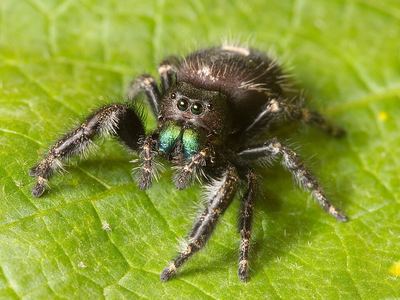
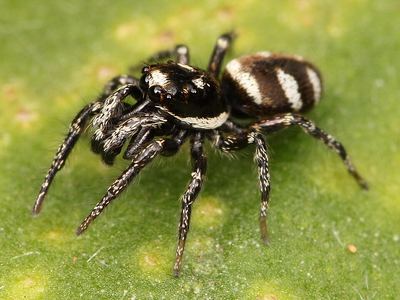
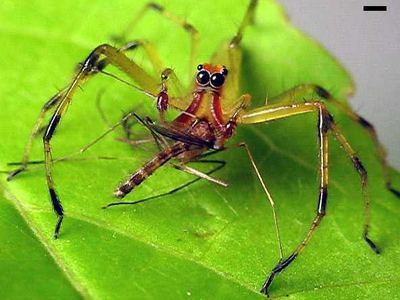
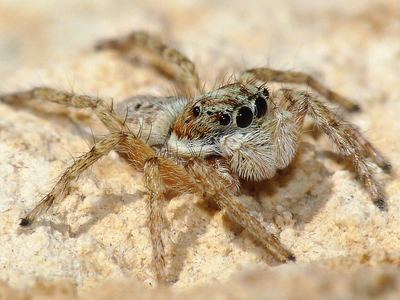
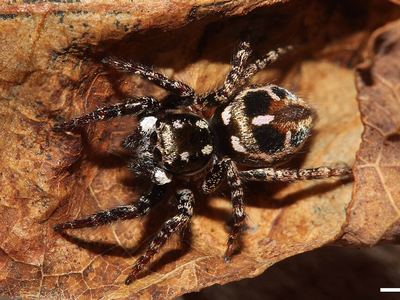
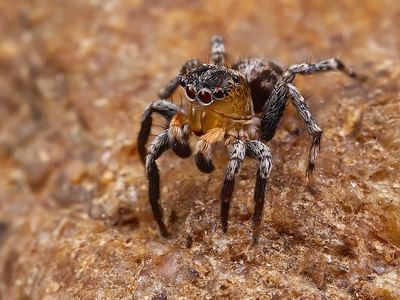
Other members of the family Salticidae with profiles here: Bold jumper, Zebra spider, Bronze jumper, Magnolia green jumper, Half-edged wall jumping spider and Twin-flagged jumping spider.
GBIF records read 2026-09-29. Listed: any license. Counted: CC0/CC BY only. How we count.